Pipeline report is available in the Sell core app and in the legacy Pro, Ultimate, Performance, and Enterprise plans. Learn more about our Plans & Pricing.
The pipeline report under Reports > Sales > Pipeline report is based on your sales predictions, since you are in charge of your sales. It requires two types of data:
- Probability rates: Define the closing probability rates for each stage in your pipeline.
- Estimated closing dates: Set an estimated closing date for each deal.
Based on the above data, the pipeline report will show the weighted averages for future months by stages. Thanks to that, you can be so much better at forecasting, and you’ll always know whether there are enough opportunities in your sales pipeline.
Jump to...
1. Requirements for the pipeline report
You need to set up both the probability rates and the estimated closing dates for your deals for the pipeline report to be accurate and useful.
1.1. Set the probability rates
To set the probability rates for your pipeline stages:
- Go to Settings > Site settings > Statuses and open the Quotes and pipeline tab.
- Enter a probability percentage in the Probability column for each status in your sales pipeline and click Save.
1.2. Set an estimated closing date for quotes
When creating a new quote for a customer, always use the Estimated closing date field to indicate how soon you expect to close the deal.
If needed, you can also make the Estimated closing date into a mandatory field for quotes to make sure all users always set it when creating new quotes:
- Go to Settings > Site settings > Mandatory and unique fields.
- On the Quotes row, click the plus icon, select the Estimated closing date field from the dropdown list, and click Save.
2. Enabling the pipeline report
The pipeline report can be accessed by users with the View pipeline report permission in their permission set.
Learn more about managing permission sets.
3. Using the pipeline report
To access the pipeline report, go to Reports > Sales > Pipeline report.
By default, the pipeline report tracks the sales funnel based on the total estimated sum of quoted services. However, you can use the Based on filter to select different types of data based on which to track your sales:
- Margin – the quoted margins (if margins are activated on your site)
- Number of quotes – the total number of quotes issued
- Custom fields you've created on your site for quotes that are filterable number fields (e.g., Monthly fee, Number of users, etc.)
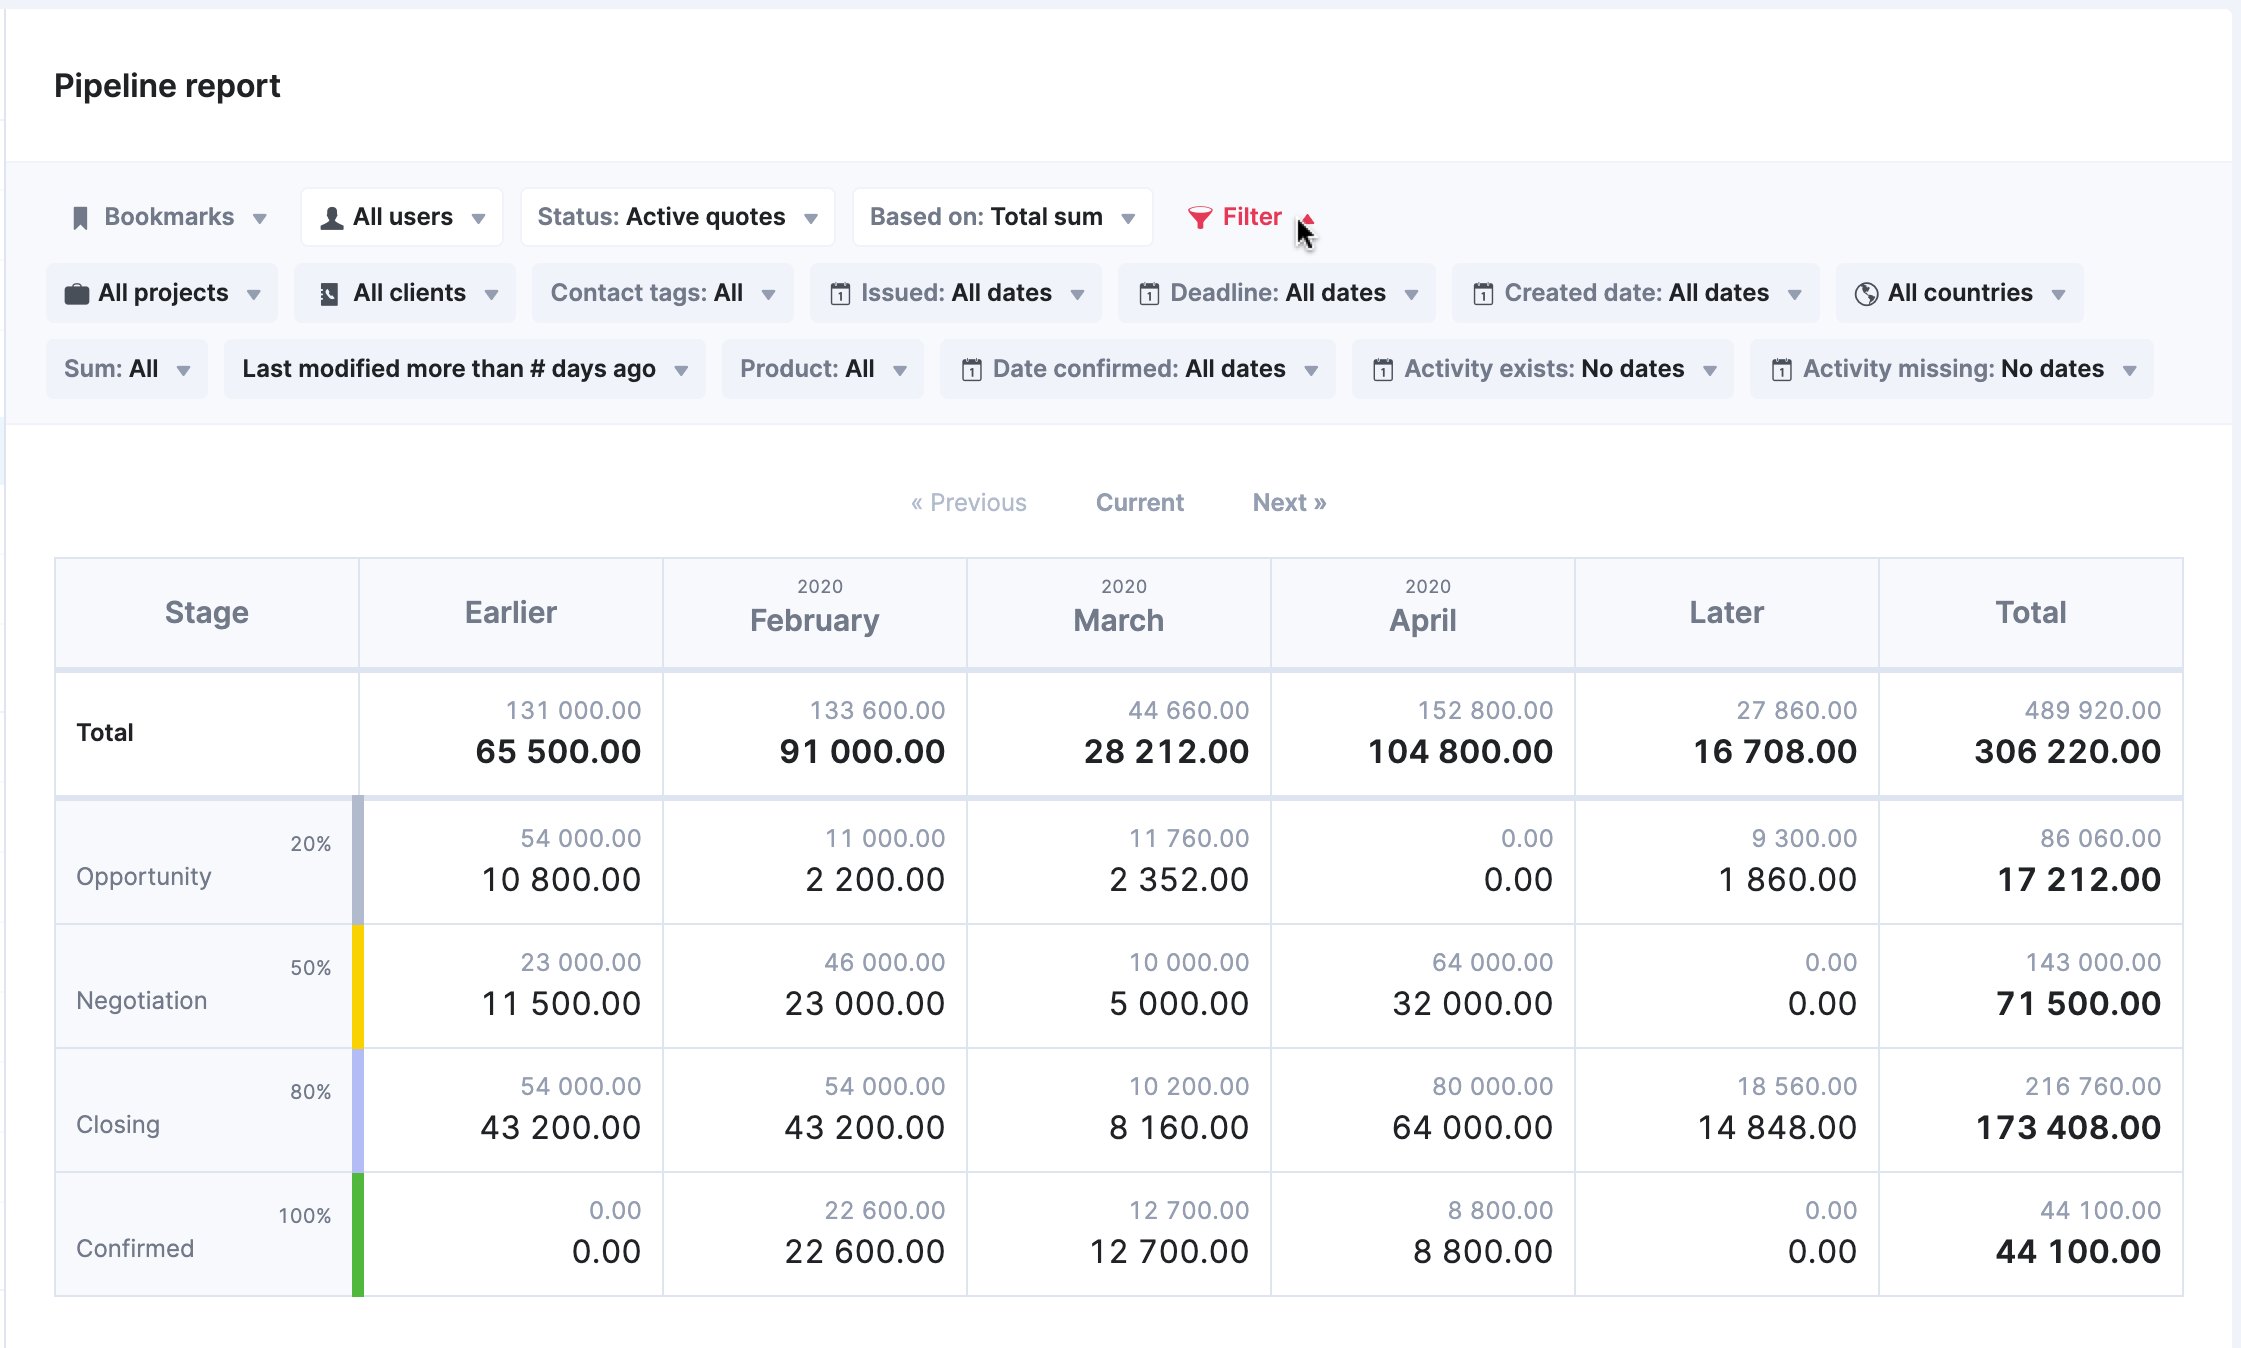
The pipeline report shows the pipeline stages and the total values in each period:
- The top value indicates the actual number (of quotes, margin, total sum, or whatever else you've based the report on) of the specific pipeline stage and period.
-
The bottom value indicates the probable (estimated) value of the specific pipeline stage and period.
- It is calculated based on this formula:
[the actual number] x [probability rate] of the specific pipeline stage and period - For more detailed information on the related sales deals, simply click on the value to open a filtered list of quotes in this stage and period.
- It is calculated based on this formula:
To see the historical data (e.g., the previous month) in the pipeline report, check the data in the Earlier column and click on the bottom value to see the past deals.
3.1. Filtering the report view
You can filter the pipeline report by users, quote statuses, projects, clients, quote issue dates, and more. Simply click the Filter button and select the necessary filters.
Pro tip! Save your favorite pipeline report views as bookmarks for quicker access later!
3.2. Summarizing data across multiple entities
The pipeline report supports multiple entities and allows you to create a summarized pipeline report based on data under various entities. If your site has multiple entities set up, simply use the Entity filter, select which entity data you want to summarize, and click Filter.
4. Frequently asked questions (FAQ)
Can you export data from the pipeline report?
No, exporting data from the pipeline report is not possible at the moment. You can try creating a PDF printout of the pipeline report view using Ctrl+P or Cmd+P, or export the relevant quotes from the quote list view.